Where solar is being built, how fast, and what's making the growth self-reinforcing
Solar is the cheapest source of bulk electricity in many countries, and the quickest to deploy, and now you couldn't stop it being built if you wanted to.
This module covers the following five lessons:
In this lesson, you will see how fast solar is being built — and why the deployment curve is still steepening.
In Module 5 we looked at the learning curve — each doubling of cumulative deployment drives costs down by roughly a quarter. This module is about where that deployment is actually happening. And the short version is: everywhere, fast.
By the end of 2025, global cumulative solar capacity reached close to 3 TW, around 2,850 GW. That's enough to generate a meaningful share of the world's electricity on any sunny day. More striking is the pace: roughly 650 GW was added in 2025 alone, on top of a record 600 GW in 2024. A single year of additions now exceeds the world's entire installed base as recently as 2018.
This isn't a plateau. We're still on the steep part of the S-curve, with annual additions doubling roughly every 3 years. And here's the self-reinforcing bit from Module 5: the deployment is the doubling that drives cost down. We'll see who's building all of this and where in the next lesson.
More solar → cheaper solar → more solar. Every gigawatt installed helps drive down the cost of the next. The learning curve from Module 5 and the deployment curve in this module are two views of the same flywheel.
That's why a plateau looks increasingly unlikely: 2025 added ~650 GW, an 8–11% gain on 2024's record, and 2026 is on track to do it again.
Step back from solar for a moment and look at the whole electricity mix. Coal still leads in raw terawatt-hours. Gas keeps climbing. But solar, invisible on this chart in 2010, is the fastest-growing source by far. But, it still has a long way to go.
To make solar useful around the clock — and to keep the grid stable as more of it arrives — batteries have to scale alongside it. The chart below shows the significant growth required.
In 2024, at COP29 in Baku, 72 countries signed a target of 1.5 terawatts of total energy storage by 2030, of which the IEA's battery-specific path requires roughly 1,200 GW — a 14-fold scale-up from today's 86 GW. Module 4 showed that batteries are on the same kind of cost curve as solar, a few years behind. The COP29 commitment is where policy meets that cost curve: governments are now targeting the scale-up that falling battery costs have already put within reach.
In this lesson, you will see who is building solar, where, and why each market has its own driver.
China dominates. There's no way around that fact. Over 60% of 2024's global solar additions were in China. But the story isn't just about one country, it's a widening map.
China leads because of industrial policy, domestic manufacturing, and sheer scale of electricity demand. It's building solar at a rate that makes everyone else look cautious. India is on a steep trajectory of its own, driven by energy security concerns and a national solar mission targeting hundreds of gigawatts. The United States got a major boost from the Inflation Reduction Act (IRA) in 2022, which unlocked billions in tax credits for clean energy. The EU accelerated after the 2022 energy crisis and will accelerate again after the 2026 energy crisis. And Brazil has quietly become a global leader in distributed solar generation, driven by net metering rules that made rooftop solar economically irresistible.
Each market has a different driver — industrial strategy, energy security, competitive auctions, consumer economics. That geographic spread matters. It makes the learning curve more robust: no single market can stall it. Even if one country slows, the others keep the flywheel turning.
"It is no accident that the countries that have the highest solar deployment — China, USA, Western Europe — are the countries that have the lowest cost of capital."
— Dany Qian, Vice Chair, JinkoSolar (GSC 2025)
The driver behind the drivers is finance. Solar modules cost roughly the same everywhere, but borrowing costs vary by an order of magnitude. Africa hosts 17 % of the world's population but receives 3 % of global energy investment.
That gap is also why so much African solar arrives as off-grid kit and mini-grids rather than utility-scale farms (Module 1, Lesson 5). A village mini-grid needs a fraction of the capital, and pay-as-you-go financing collects it in instalments small enough that a household with no credit history can carry them.
The bar chart above shows annual volume by region. The same data, viewed below as shares of each year's additions, makes the regional mix easier to read at a glance — particularly the handover from European growth in the early 2010s to China's industrial dominance by the late 2010s, with India and others slowly diversifying the picture. Drag the year slider on the pie chart below to watch that handover happen.
Now let's look at the scale mix. Globally, utility-scale dominates: roughly 60% of new additions are these tens-to-hundreds-of-MW solar farms. But the split varies sharply by country. Australia is the outlier at the distributed end — around half its installed solar is rooftop, the highest residential share in the world. Brazil's net-metering rules have pushed its distributed share to 35%. The USA and India lean hard on utility-scale tenders. China does both, at breathtaking volumes.
The fastest-growing scale depends on where you stand. Utility-scale is exploding in China, India and the US — big tenders meeting cheap modules. Rooftop is led by Australia and Brazil on household economics, with Europe accelerating after 2022. C&I is growing steadily across Europe, the US and India as commercial power purchase agreements proliferate.
The implication is the point of this lesson: no single scale and no single country is carrying this growth. It's diversified. Stop any one market and the others keep the learning curve running.
The geographic spread of the top five markets is not just an accounting detail — it's what makes the learning curve hard to stop. Industrial policy in China, security policy in the EU, consumer economics in Brazil, auction design in India, and tax credits in the US are all different levers pulling on the same flywheel.
In this lesson, you will see where solar is taking the biggest bite of the electricity mix — and which countries are running the most aggressive experiments.
Growth isn't evenly spread. A handful of countries are genuinely running out ahead — not just on volume, but on penetration: the share of their annual electricity that solar actually delivers.
By 2024, solar supplied roughly 7–8% of global electricity, and 2025 nudged that share higher again. But this global average masks a huge spread. Chile, Spain, Greece, Australia and the Netherlands are all above 18%. Germany is around 13%. The UK sits near 5%. China, the USA and India are each at 6–7% despite installing massive raw capacity every year. Brazil is at 8–9% and rising fast.
Solar scales in two different ways at once — by raw installationThe amount of new PV capacity installed in a country's system. in big industrial economies, and by solar penetrationThe amount of electricity delivered by solar as a proportion of the total amount of electricity generated. in countries where the resource is strong enough to push solar to the top of the merit order for hours at a time.
The penetration leaders are mostly small, sunny, or both. The raw installation leaders are neither — they're big and often cloudy. The raw-installation story and the penetration story run in parallel, and only partly overlap.
To see why those stories diverge, it helps to see where solar is being deployed across the grid. The open-source map below from OpenInfraMap plots solar generation across Asia, set against the high-voltage transmission network.
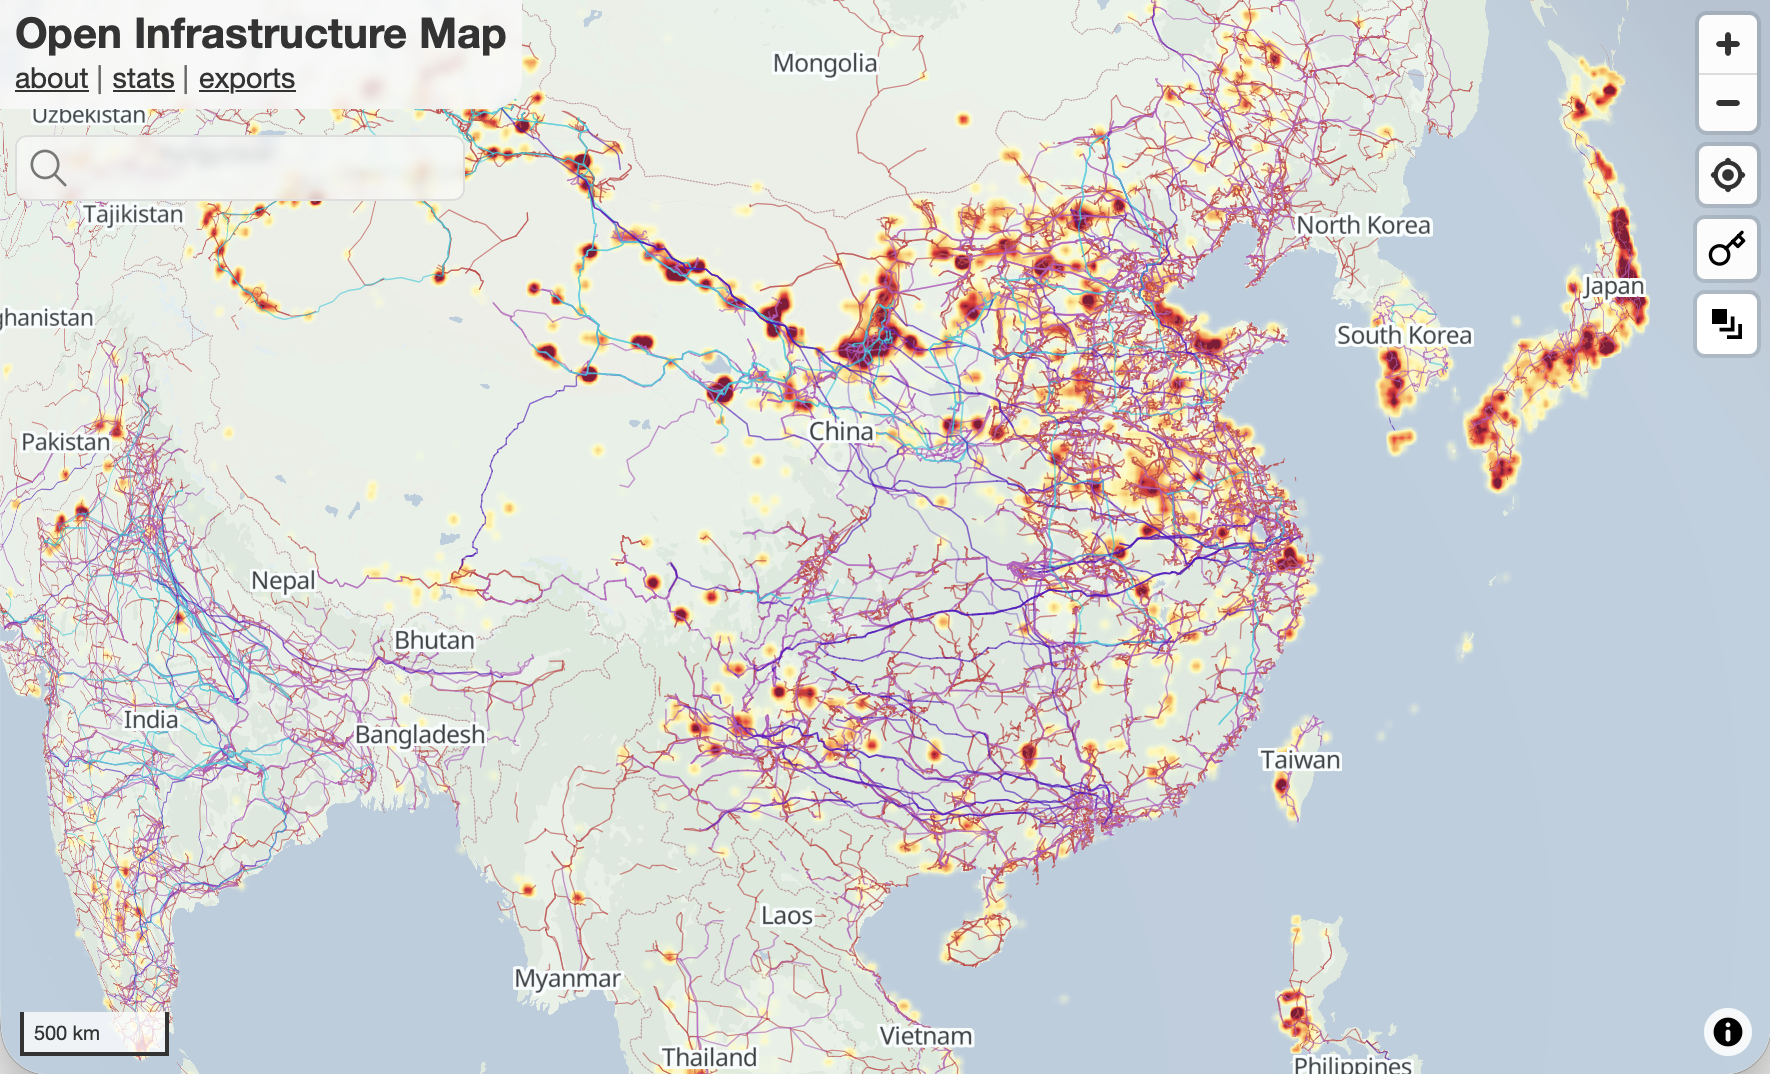
Heat clusters mark concentrations of solar generation; coloured lines are high-voltage transmission. The dense band across eastern China, Japan, Korea and northern India is exactly where the raw installation leaders are building solar. Their electricity systems are huge, and their skies are often cloudy, so even large amounts of solar still meet only a small share of total demand there for now.
The interesting line isn't "who installed the most megawatts." It's "whose grid already runs on solar for part of the day." Chile, Spain, and Australia regularly see solar supplying more than half of daytime electricity demand — which is why they're the ones now writing the playbook for storage, curtailment, and grid-code reform that everyone else will need in five years.
In this lesson, you will see why installation speed — not module price — sets which countries grow fastest.
You've just seen the shape of global growth: utility-scale dominates the totals, rooftop tops the mix in Australia, and distributed solar booms in Brazil. So why such different shapes in countries with broadly similar sun? The answer is no longer "panel price". Modules are a globally commoditised product — the same Chinese factories ship to every market, at roughly the same dollar-per-watt. What separates fast markets from slow ones is whether they can put those modules on roofs and racks and get the power into substations.
Module costs have fallen so far that in mature markets, the panel accounts for only about a quarter to a third of total system cost. The rest is what the industry calls balance of system (BoS)In the US, BoS and soft costs are now around 65% of a residential solar install — versus closer to 35% in Australia, where competition and lighter permitting have squeezed it down.: racking, wiring, invertersPower electronics that convert direct current (from PV modules) into alternating current (used by devices), and vice versa., labour, permitting, design, grid connection, and everything else that isn't the panel. That's where the remaining cost reduction has to come from — and it's also why two countries paying the same price per watt for modules end up with wildly different installed costs.
The same picture holds for batteries. Cells are still the largest single hardware line, but soft costs — installation labour, permitting, and grid hookup — already eat the biggest single slice.
Installation labour is now the binding constraint in many markets. Training enough skilled installers, streamlining permitting (which can take months for what is a straightforward rooftop job), and standardising racking systems are the new frontiers of cost reduction.
Countries that crack this grow fastest. We can't rely on the manufacturing revolution to keep installed costs falling at their current trajectory. Each market now has to tackle its own hardware, inverter, labour and permitting overhead.
This is a different kind of challenge from manufacturing. You can't automate a roof installation the way you automate a factory line. But you can reduce the paperwork, train the workforce, and standardise the hardware. The learning curve still applies — it just works differently for soft costs than for hard technology.
Australia's rooftop boom didn't happen because the country invented new modules. It happened because the country standardised the paperwork, trained the installers, and let households move quickly. Where permitting is slow, even cheap modules pile up on warehouse shelves, access to cheap, plentiful solar power is constrained, and countries fall behind.
In this lesson, you will challenge the "not enough space" narrative with the actual numbers.
There's a persistent narrative that we'll run out of space for solar. It comes up in pub conversations, planning objections, and newspaper editorials. It doesn't survive contact with the numbers.
Let's take the UK — cloudy, densely populated, and one of the harder cases. The UK could meet its entire electricity demand from solar panels covering roughly 1.2% of its land area — around 7 times less than the land that has already been built on as UK towns and cities.
Sunnier countries with more land per head need a tiny fraction of that. India sits at about 0.33%, Brazil at 0.05%, and Australia at 0.02%. Japan and Germany — denser and cloudier — sit higher.
Translated into actual area, 1.2% of the UK works out to roughly 3,000 km² — about twice the size of Greater London, or two-thirds the area of Devon. That's only a little more than the UK currently devotes to golf courses and car parks combined (~2,000 km²), and under 2% of UK farmland.
There's a hidden assumption in that 1.2%: that we build it all on open land. We won't, and we don't have to. A solar farm packs about 100 MW into a square kilometre. Urban areas manage 15 to 40 MW per square kilometre from their rooftops — around a third of the density, but on land that is already spoken for.
Across Europe, only about one roof in ten currently carries panels. Every one of the others is an opportunity. Rooftops won't do all of it, but they will make up a large proportion of the deployment.
The space question is real as a planning and social acceptance issue — nobody wants a solar farm next to their kitchen window. But it's not a physics problem. It's a policy problem. There's plenty of space. What's often missing is planning permission, grid connection capacity, and the political will to use land that's currently underutilised. We'll see in Module 9 how spatial planning — directing solar to areas with grid headroom — is one of the key policy fixes.
Project footprint at modern density (≈1 hectare per megawatt, bifacial fixed-tilt) and real-world capacity factors. The module-only area would be roughly 4× smaller. Sources: NREL US Utility-Scale Solar Land Use, Solar Energy UK project data, IEA capacity factor benchmarks.
Batteries barely add to the footprint. A grid-scale BESS serving a city fits on a few hectares. The footprint is negligible compared to the solar generation it supports.
In this lesson you will meet the part of the growth story that has nothing to do with grids — and see why, for most households, a system they own outright beats buying into a shared one.
Everything in this module so far has assumed a grid. Solar gets added to a network that already exists, and the argument is about how much and how fast. For around 650 million people, most of them in sub-Saharan Africa, there is no network to add to. Their solar story starts somewhere else entirely.
The grid is not coming soon, and the arithmetic explains why. Extending a national network is cost-effective where people are dense and close together, but the cost per connection climbs steeply as villages get smaller and further apart. Past a certain distance it is simply cheaper to generate where the people are than to run a wire to them.
So off-grid solar climbs a ladder. What makes it interesting is that each rung is a change in what the system is — not just how big it is. Have a play below: add what a household might want to run, and watch where the jumps fall.
Add household loads to see how the system design options change.
Personal — you own the system
Panel, battery and light in one moulded unit. You buy it in a shop and put it on the roof yourself, often for about what the household already spends on kerosene in two or three months.
A panel on the roof, a battery indoors, wiring to fixed points — what the industry calls a solar home system. The small ones run at 12 or 24 volts and everything they power is DC; the larger ones gain an inverter along the way. This single rung carries almost everything a household actually asks for: lights, phone, fan, television, water purification, a fridge, even a borehole pump.
Cooking, a motorbike to charge, air conditioning — any one of these breaks the small home system on its own. Kilowatts for hours at a time means several modules, a real inverter and a battery bank: an engineering job rather than a product bought off a shelf.
Collective — you own a share
Not a bigger rung — a different answer to the same load. One array and one battery shared across tens to a few hundred homes, instead of every household oversizing its own. It needs less capacity per home, because households do not all peak at once. What it needs instead is a shared way to fund the asset, renew it when the battery dies, and ration it when the sun does not shine.
Notice how much fits inside that middle rung. Lights, a phone, a fan, a television, clean water, a fridge, even a borehole pump — all of it on a panel or two and a battery the household owns outright.
What breaks the small home system is heat and transport. Cooking on electricity instead of charcoal, charging a motorbike a rider works on all day, heating water, running air conditioning through the hottest hours: any one of those on its own needs more than one panel and one battery. They are also, not coincidentally, the things households want most once the lights are on.
The reason any of this sells is a financing trick rather than a technological one. Pay-as-you-goPAYGo for short. The lock is the product: a kit that can switch itself off remotely is collateral a lender can actually repossess, without ever visiting the village. lets a household pay in small instalments by mobile money instead of finding a lump sum it could never raise. Unlock codes arrive by SMS, and if a payment is missed the kit locks itself until the household catches up. That remote switch is what makes lending to a customer with no credit history and no collateral possible at all.
Member companies of GOGLAFounded in 2012 and based in the Netherlands. Its members run from multinational manufacturers to single-country distributors, and because the sector has no official statistics, GOGLA's half-yearly sales data is what everyone quotes instead., the trade association for the off-grid solar industry, sold more than 10 million off-grid solar kits in 2025 — the highest year on record — and now reach over 148 million people. Sub-Saharan Africa took more than 90% of those sales.
It is also a growing employer, and one that recruits very differently from the European solar industry — there are links in Careers & Resources at the end of the course.
Once a household's load gets big enough, a second option appears: share it. A mini-gridCalled a micro-grid at the smaller end. Most pair solar with batteries and keep a diesel generator only as backup — the exact reverse of the arrangement they replace. is a village array, a battery bank, and its own poles and wires. Sharing needs less capacity per home than everyone self-supplying, because households don't all peak at once. That is the same argument that justifies any grid, at any scale.
But a shared asset has to do three things a private one doesn't, and this is where the interesting arguments live.
Fund it. Someone pays for the array, the battery, the poles, the wires and the meters. Distribution alone runs to roughly $1,000 per connection, before a single panel is bought.
Renew it. The battery wears out at eight to fifteen years while the array runs past twenty-five. That means money set aside regularly, whatever you choose to call it.
Ration it. A shared battery is finite. If power is free at the point of use, nothing stops the heaviest user flattening it by nine in the evening. A price per unit is a rationing mechanism as much as a revenue one.
A tariff is not a physical necessity — it is simply one mechanism that happens to do all three jobs at once, which is why commercial operators default to it. A community co-operative can do them far more cheaply, with no investor return to service. It still has to do all three.
And here is the honest part. Between 2010 and 2020, 74% of Africa's off-grid energy investment went into individual systems, not shared ones. Mini-grid electricity has come down from about $0.55 per kWh in 2018 to roughly $0.38 by 2022, and could reach $0.20 by 2030 — but a national grid tariff is $0.10 to $0.25, and regulators in several African countries have capped mini-grid tariffs near grid parity on fairness grounds. Developers say that makes projects unbankable. Both sides have a point, and the argument is live right now.
So the ladder is real, but it doesn't have a single right answer at the top. For most households, a system they own outright wins comfortably. Shared arrays earn their place where there are loads no household owns — a clinic, a school, a workshop, a water pump — and where a community can fund and run the asset cheaply enough. That second condition is the harder one. It is exactly the problem pay-as-you-go solved for individuals, and has not yet solved for communities.
Six questions to round out the module. Your score will be shown at the end.
Global solar deployment has reached roughly 2.9–3 TW cumulative, with ~600 GW added in 2024 and ~650 GW in 2025 — more in a single year than the world's entire installed base as recently as 2018. We're still on the steep part of the S-curve, and the learning curve keeps the flywheel spinning: more solar, cheaper solar, more solar.
Five markets dominate — China, the US, India, the EU, and Brazil — each driven by a different mix of industrial policy, energy security, competitive auctions, and consumer economics. That spread makes the curve robust: no single country can stall it.
Growth is diversified across scales and regions: utility-scale leads globally, rooftop tops the mix in Australia and is booming in Brazil, and penetration is highest in small, sunny countries like Chile, Spain, and Greece — ahead of the gigawatt giants on the share of electricity already being served by solar.
The pacing factor is no longer module price. With panels at roughly a quarter of system cost in mature markets, installation labour, permitting, and balance-of-system overheads now decide which countries grow fastest. Australia's rooftop boom — same modules as everywhere else, faster paperwork — is the worked example.
The blocking constraints are mostly institutional: grid connection queues and planning friction. Space is not a constraint — the UK could meet all its electricity demand from solar on about 1.2% of its land area (about the area of UK golf courses and car parks combined), and sunnier countries like India and Brazil need a fraction of that.
And one growth story in this module has no grid in it at all. For the 650 million people without mains electricity, solar arrives as a product rather than a connection: a lantern, a home system, and pay-as-you-go financing that made both affordable. Shared village arrays are the contested part — 74% of Africa's off-grid investment has gone to systems households own outright, because at household scale the poles and wires cost more than the alternative.
Next up: In Module 7, we step inside the factories. We'll trace the solar and battery supply chains from raw materials to finished products — and explain why almost all of it happens in China.

You now understand where solar is being built, how fast, and why the growth is self-reinforcing — along with the real constraints (mostly institutional) and the non-constraint (space).